
Reaction Commerce is a full-stack, self-hosted commerce platform you can run for as little as $10 on your own VPS. Think of Reaction Commerce as what WooCommerce might’ve become had it not been dependent on PHP/WordPress and instead was rewritten using modern coding languages and development techniques.
Using self-hosted commerce is like having your own personal Shopify, WIX or BigCommerce right at your fingertips. Only there’s no monthly costs to worry about just to use it. And there’s no vendor lock-in which would otherwise make it too difficult or risky to switch between platforms when the need arises.
After you’ve learned the basics of Getting Started you’re ready to dive deeper into the code and learn how things work. One of the best ways to learn any new system is to look for bugs and figure how to debug them. And in this tutorial I will show you some strategies for debugging source code in Reaction Commerce.
Step Debugging Basics
Step debugging has come quite a long ways since I wrote my Node.js Debugging Primer in 2013. Back then we didn’t have the great tooling to debug Node.js apps like we do today. In fact, debugging tools were also all over the place.
Fast forward to today and now we have probably the greatest tools ever created for developing and debugging web applications called Visual Studio Code. If you don’t have VS Code, download and install it before you continue.
Once you’ve got VSCode installed take some time to read though the following tutorial on how to set-up and configure step debugging: 5 Steps to debugging Next.js/Node.js from VSCode or Chrome DevTools.
When you’re finished learning how to debug your demo app, return here to apply your knowledge to Reaction Commerce — which runs Node with an additional layer of abstraction by containerizing apps/services using Docker.
Debugging the API
Assuming you’ve already installed the Reaction Development Platform locally run docker ps to confirm services are running. You should see output like:
CONTAINER ID        IMAGE                                  COMMAND                  CREATED             STATUS              PORTS                                                      NAMES
e066e1f9017c        reactioncommerce/node-dev:12.14.1-v3   "tini -- /usr/local/…"   23 hours ago        Up 23 hours         0.0.0.0:3000->3000/tcp, 0.0.0.0:9229->9229/tcp             reaction_api_1
fdbf85cfbca1        mongo:4.2.0                            "docker-entrypoint.s…"   23 hours ago        Up 23 hours         0.0.0.0:27017->27017/tcp                                   reaction_mongo_1
e03deaac4da5        reactioncommerce/node-dev:10.16.3-v2   "tini -- /usr/local/…"   24 hours ago        Up 24 hours         0.0.0.0:4000->4000/tcp                                     example-storefront_web_1
928ea892ac82        reactioncommerce/admin:3.0.0-beta.9    "docker-entrypoint.s…"   6 weeks ago         Up 24 hours         0.0.0.0:4080->4080/tcp                                     reaction-admin_reaction-admin_1
30c48b24670f        reactioncommerce/identity:3.2.0        "docker-entrypoint.s…"   7 weeks ago         Up 24 hours         0.0.0.0:4100->4100/tcp                                     reaction-identity_identity_1
98070f09692b        oryd/hydra:v1.0.8                      "hydra serve all --d…"   7 weeks ago         Up 24 hours         0.0.0.0:4444-4445->4444-4445/tcp, 0.0.0.0:5555->5555/tcp   reaction-hydra_hydra_1
878f1551dbf7        postgres:10.3                          "docker-entrypoint.s…"   7 weeks ago         Up 24 hours         0.0.0.0:32770->5432/tcp                                    reaction-hydra_postgres_1
The first running container e066e1f9017c has NAME of reaction_api_1. That’s the Reaction Commerce API and the first thing we’re going to debug.
In the IMAGE field you may see reactioncommerce/reaction instead of reactioncommerce/node-dev. If that’s the case, you need to start the API in development mode. To start the API in development mode use the purpose-built script in the Makefile which ships with reaction-development-platform:
cd reaction-development-platform && \
make dev-link-reaction && make stop-reaction && make start-reaction
Tip: Run make list for a list of all Makefile commands. Documentation for each command is inlined into the code and there’s a
Summary of Project Commands in the README file of the reaction-development-platform repo.
Because the API is running inside a docker container, in order to debug it, we must first confirm Docker has published the debugging port for Node so we can use the port to connect and debug the API from the host machine.
Looking back at your results from docker ps review the PORTS column and confirm the API is forwarding the standard debugging port 9229. If it’s set-up correctly, you should see something like:
0.0.0.0:3000->3000/tcp, 0.0.0.0:9229->9229/tcp
If that’s what you see your ready to start debugging the API. If port 9229 doesn’t appear here continue anyway and I’ll show you a workaround so you don’t have to spend time modifying the ports published by docker-compose.yml.
Starting the API for Debugging
Next run the API for Node debugging inside docker. There are two existing scripts inside the reaction repo’s package manifest called inspect:docker and inspect-brk:docker that will do what you need. Run the first of the two like so:
cd reaction-development-platform/reaction && \
docker-compose run --rm --service-ports --name api api npm run docker:inspect
With docker-compose run –rm aliased to dcr and reaction/pull/6301 that can be shortened to:
cd reaction-development-platform/reaction && \
dcr --service-ports api npm run docker:inspect
Add the -d flag after run if you want to run the API backgrounded. For more info see the Reaction Docs on Debugging Server Code.
Connecting from VSCode
Reaction Commerce API is already configured to work with VSCode for debugging so there’s no need to create your own launch.json file inside Visual Studio. To connect to the API for inspection and debugging from within VSCode open the reaction project and press F5 to run the debugger.
You’ll know VSCode is attempting to connect to the Node inspector when you see the following toolbar containing the step debugging tools appear within the IDE:
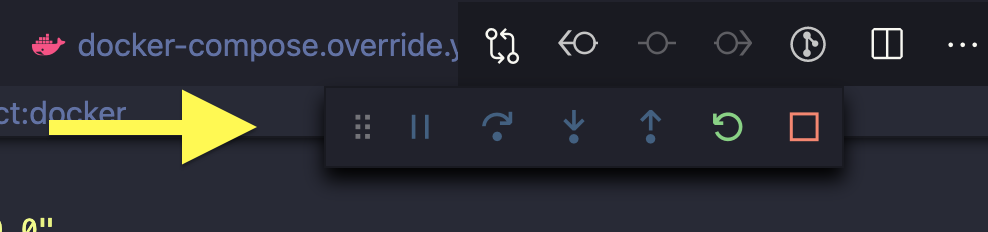
One of two things will happen at this time. Either VSCode will connect to Node via our Reaction Commerce API’s Docker container for debugging or it will timeout. You’ll know you’re connected when the Red square shown in the above image turns into a electrical plug. Otherwise it’ll timeout in 5-10 seconds.
If the debugging connection attempt times out, check for the following possible scenarios likely to cause the debugger not to connect:
- The docker container’s debugging port isn’t published
- The API wasn’t started using inspection mode
- An existing process is listening on port 9229 and needs to be stopped
Once you’ve connected from VSCode for debugging you’re ready to set a breakpoint within the API to pause code execution where your break point is.
Set a Breakpoint
Since we used inspect:docker and not inspect-brk:docker to start the Node inspector earlier where you choose to set a breakpoint will depend on whether or not the line of code you want to pause execution on will ever run again. In other words, use inspect-brk to debug start-up scripts and other bootstrapping code, otherwise simply use inspect and perform an API action to hit your breakpoint.
Open the reaction repo and list the files in the src folder:
ls src
You should see output like:
checkNodeVersion.cjs index.js mockTypes.graphql
Looks like there’s almost nothing there! That’s because there isn’t. The code in the src folder is intended only to bootstrap the API. The actual meat of the API is split into dozens of NPM packages installed via the package manifest, included via the plugins.json config and most of which will be located in the following location:
cd reaction-development-platform/reaction/node_modules/@reactioncommerce/
Use the Explorer in VSCode to locate the above directory from within the IDE. Then locate api-plugin-products/src/queries/product.js and show its GPL 3.0-licensed goodness:
 1/**
 2 * @name product
 3 * @method
 4 * @memberof GraphQL/Product
 5 * @summary Query the Products collection for a single product
 6 * @param {Object} context - an object containing the per-request state
 7 * @param {Object} input - Request input
 8 * @param {String} input.productId - Product ID
 9 * @param {String} input.shopId - Shop ID
10 * @returns {Promise<Object>} Product object Promise
11 */
12export default async function product(context, input) {
13  const { collections } = context;
14  const { Products } = collections;
15  const { productId, shopId } = input;
16
17  await context.validatePermissions(
18    `reaction:legacy:products:${productId}`,
19    "read",
20    { shopId }
21  );
22
23  return Products.findOne({
24    _id: productId,
25    shopId
26  });
27}
This file queries the Products collection in MongoDB and returns a single document from the collection representing a Product. In VSCode, click just to the left of the number representing L17 to set a breakpoint. A grey circle will appear momentarily followed by a red dot indicating the breakpoint is set.
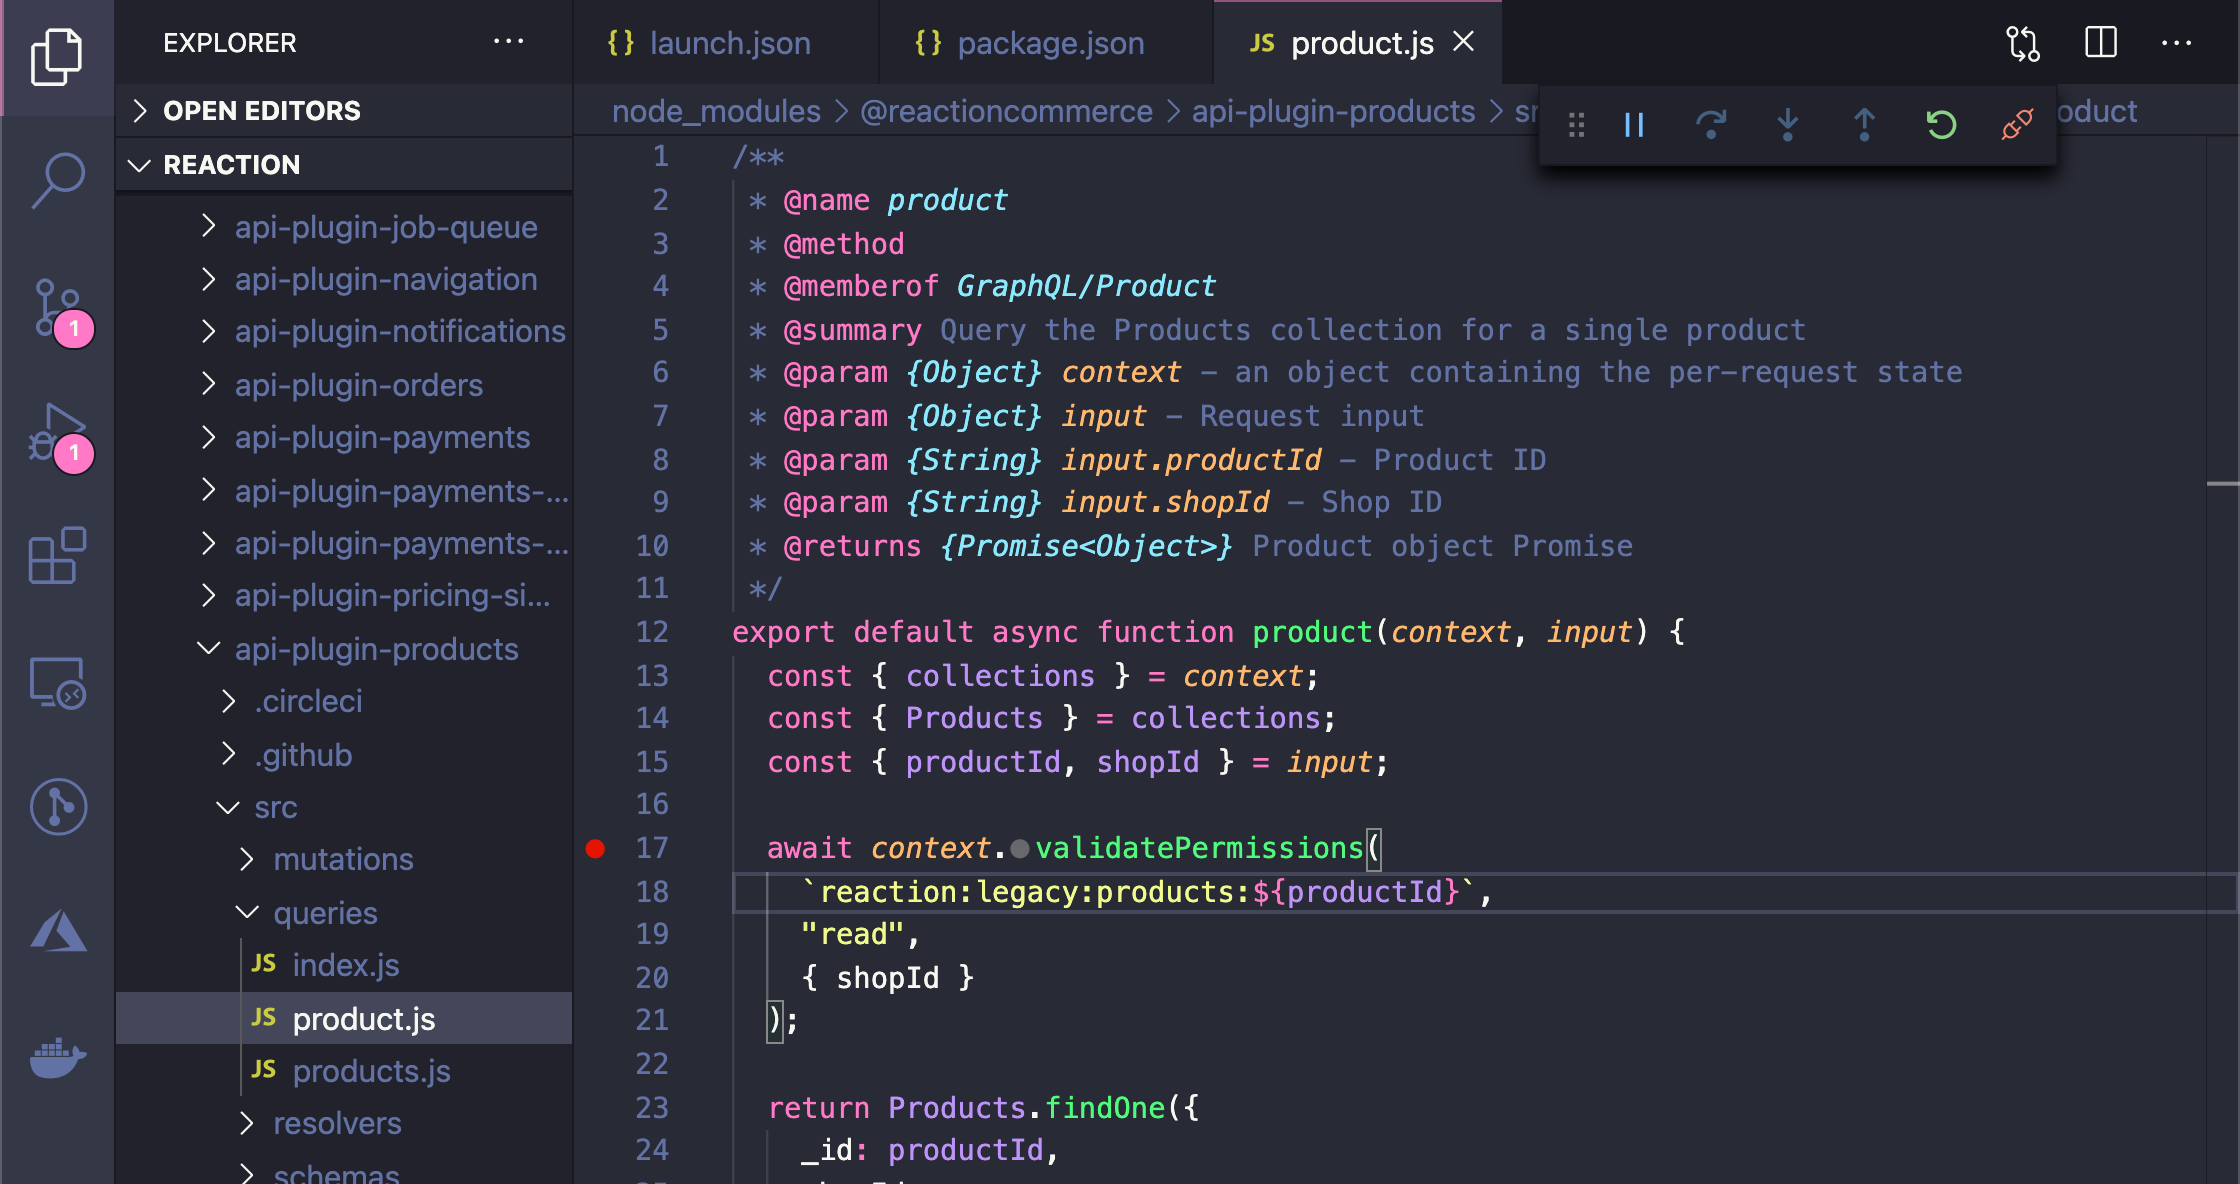
If you aren’t able to set a breakpoint on Line 17 or the circle representing the breakpoint isn’t filled in a solid red, you missed something in one of the preceding steps. Go back and figure it, otherwise just use your imagination.
Hitting the Breakpoint
The breakpoint we set in the last section falls squarely in the GraphQL query responsible for returning Product data from the database. The obvious ways to run through that code and hit our breakpoint are:
- Display a product using Example Storefront (http://localhost:4000)
- Query for product data in the GQL playground (http://localhost:3000/graphql)
We’re going to do this the fun way, using the GraphQL playground. Go ahead and open it up, click Docs and search for product in the search field. You should see something like this:
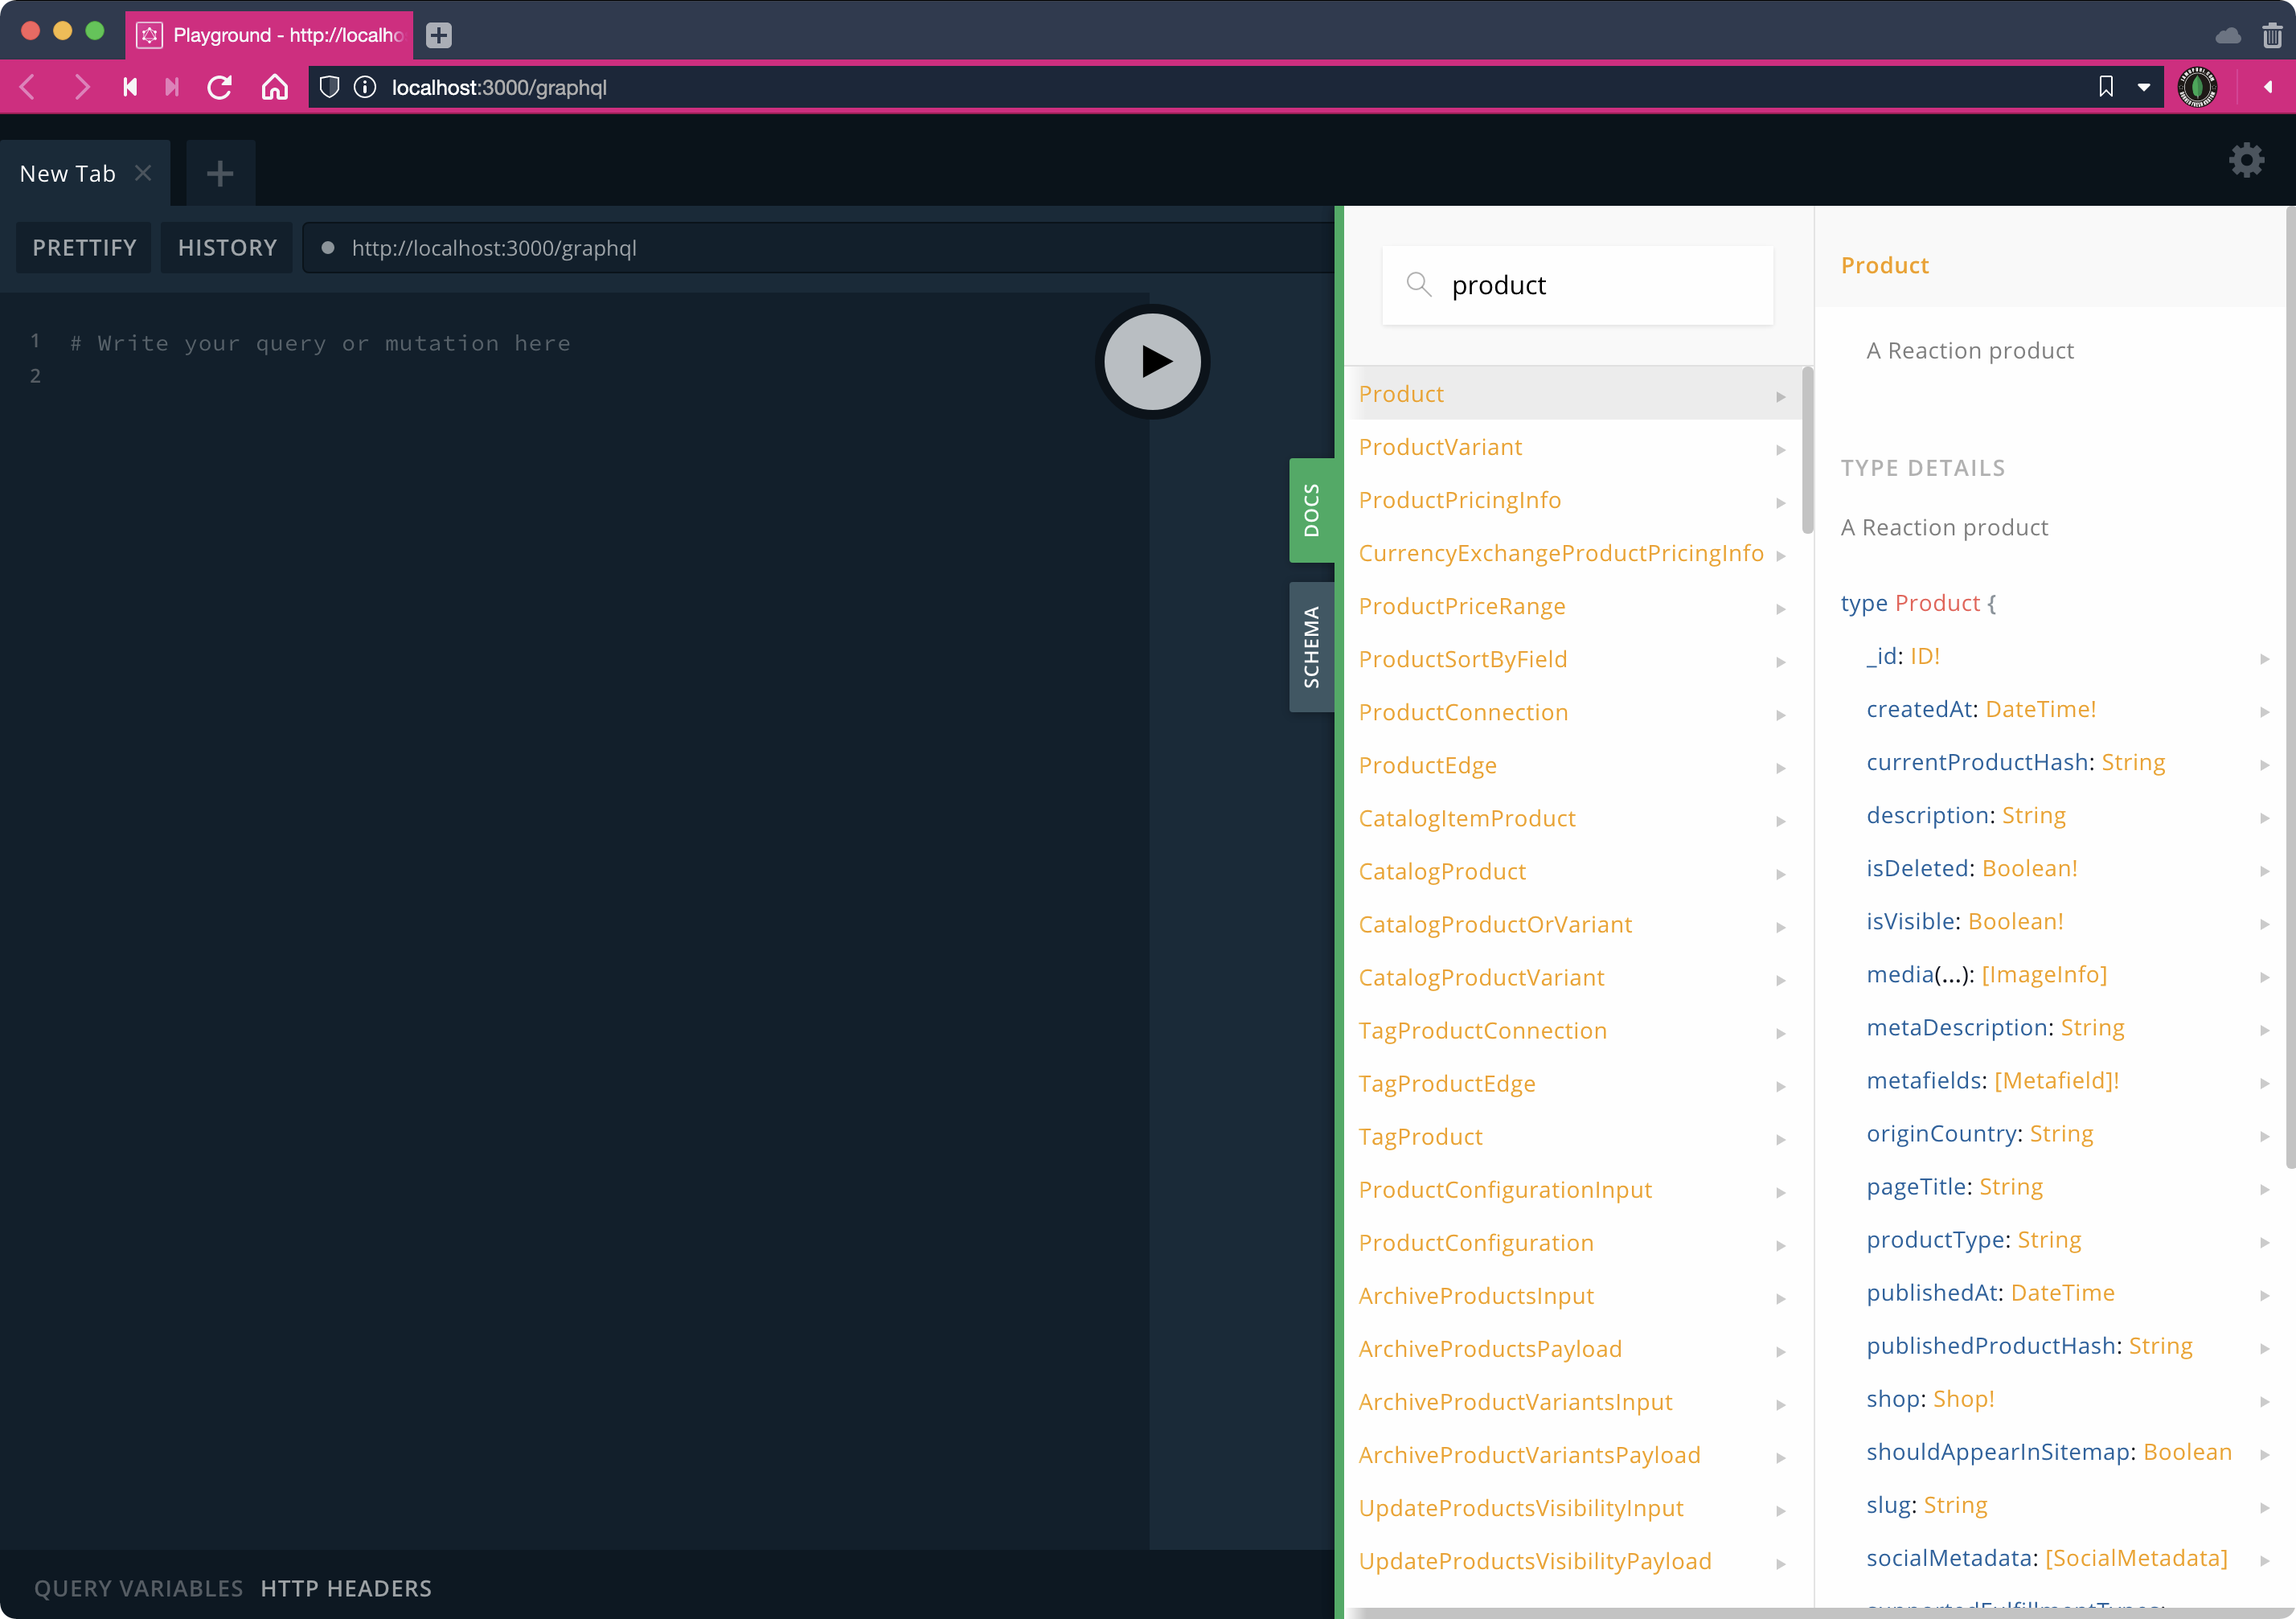
Use the Product Docs to help you fashion a GraphQL query to run in order to get product data. Keep in mind from earlier products.js requires a shopId value which you can get by running the following query:
query {
  primaryShopId
}
To get a productId connect to your MongoDB database using Compass, open the reaction database and choose any _id from the Products collection. When you’re done you should have a GraphQL query similar to:
Expand to view solution
query productQuery($shopId: ID!, $productId: ID!) {
  product(shopId: $shopId, productId: $productId) {
    pageTitle
    metaDescription
    title
    description
  }
}{
"shopId": "cmVhY3Rpb24vc2hvcDphU1lHMnhtZkNGRkZrampCZQ==",
"productId": "4FEXB5KEheZGLdtzh"
}And when you run it, the VSCode debugger will pause on your breakpoint:
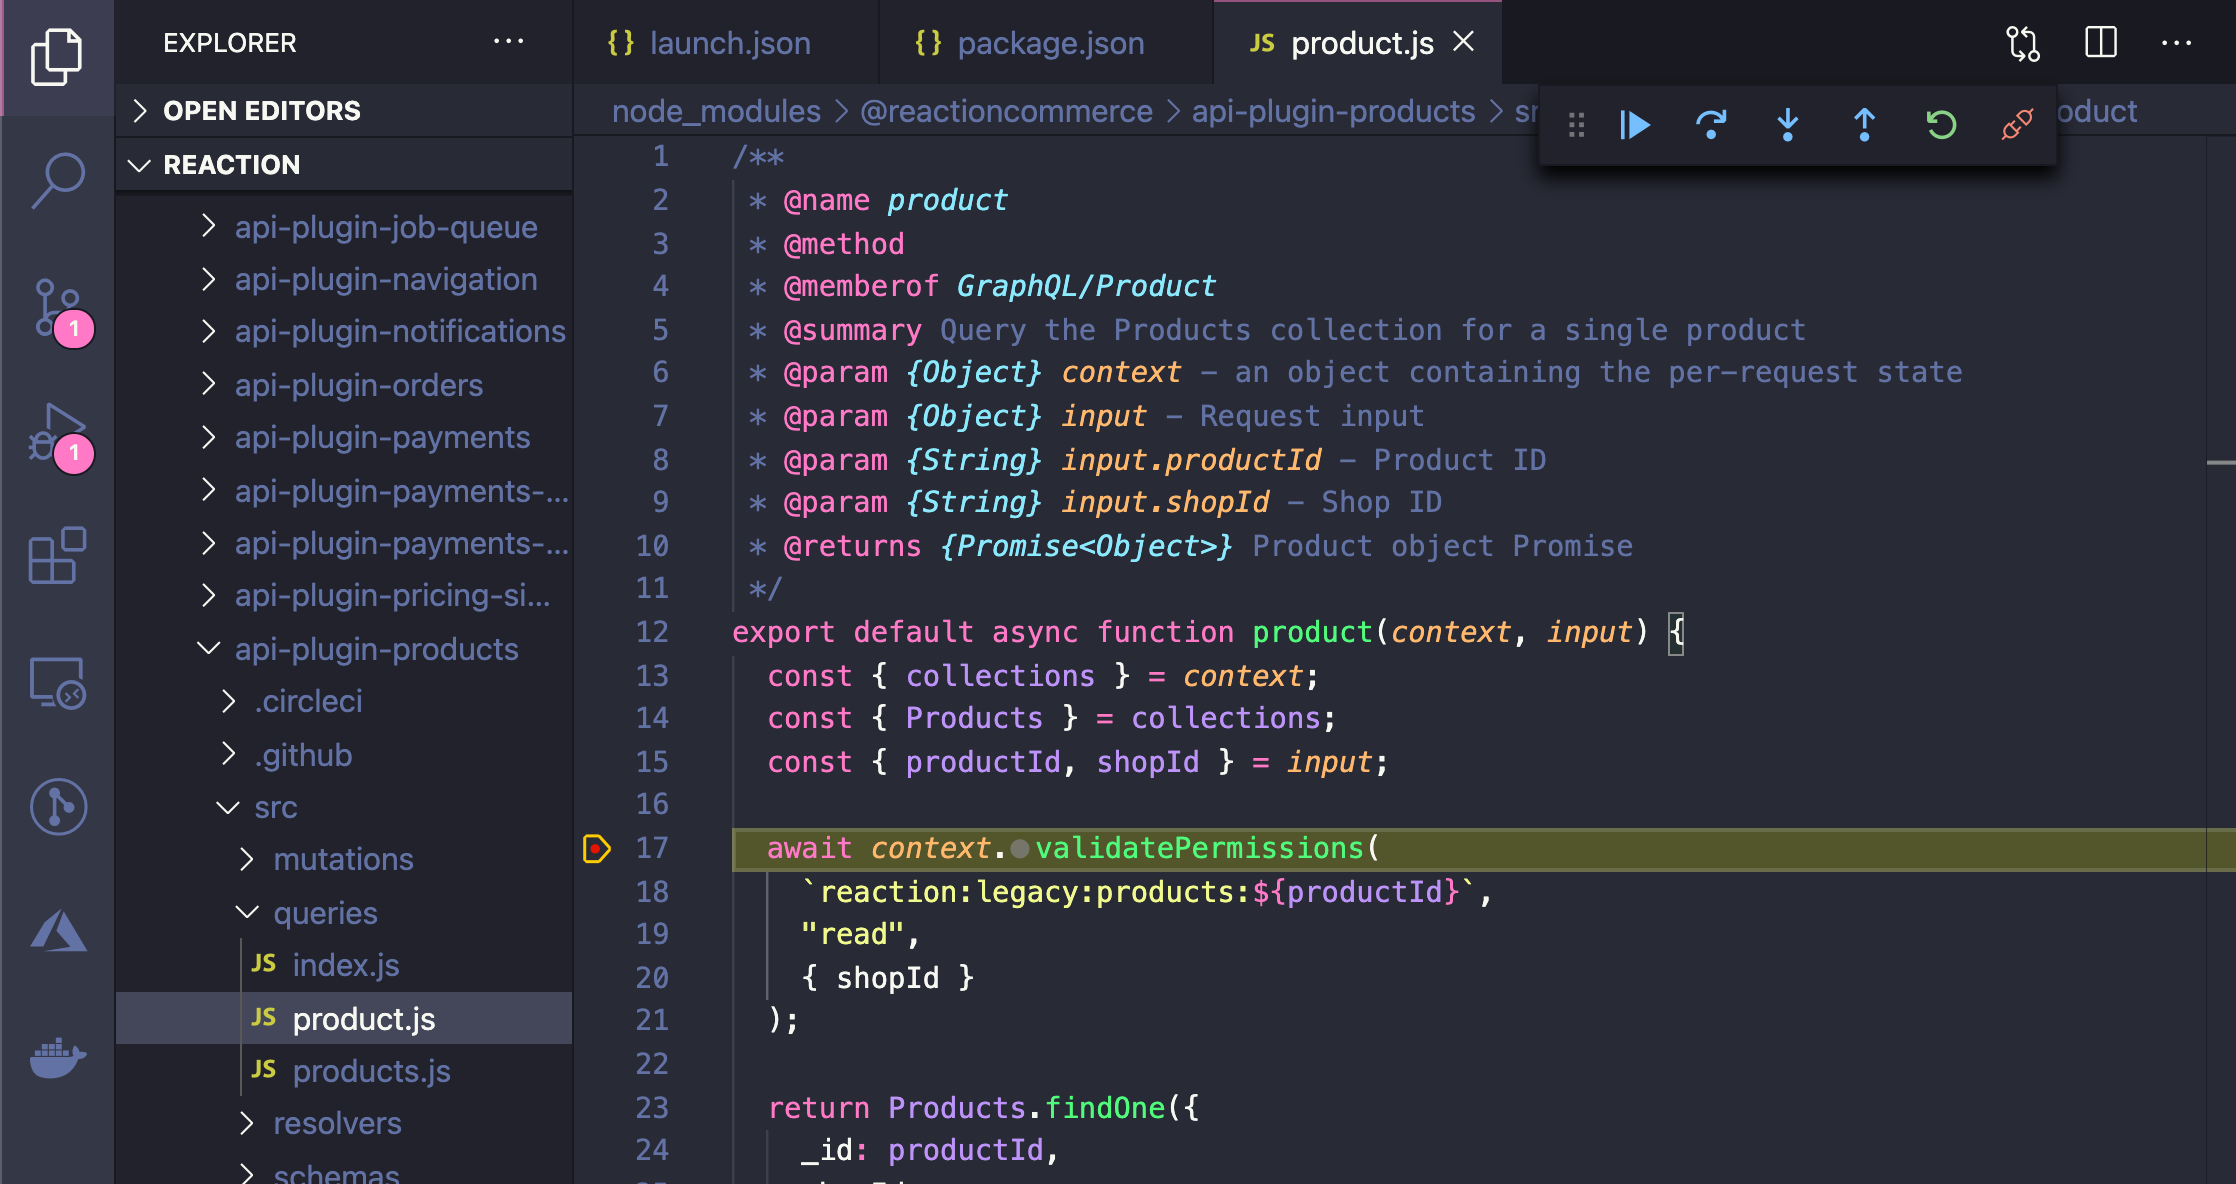
Now hover over the context identifier on the screen. That’s the application context you’ll see passed around a lot within the Reaction API. Then switch over to the Run tab in VSCode, find the Call Stack and start clicking down the list to find out what code was executed to before your breakpoint was hit. Finally, hit the Step Over button in the debugging toolbar in VSCode and practice manipulating and inspecting the program during runtime.
And that’s Step Debugging in a nutshell.
Debugging API Plugins
Using reaction-development-platform/reaction/bin/package-link allows for API plugin development and debugging. The workflow for developing and debugging API plugin packages at a high level is this:
- Clone API packages to reaction-development-platform/api-plugins using the script designed for the purpose and included in the Makefile. Note there’s also documentation for this the RDP README file.
- Use commands shared earlier to Start the API for debugging.
- Run the package linker to clone local changes into the running API container and restart the API service automatically. For example, to modify/debug api-plugin-files run the following from the reaction directory: bin/package-link @reactioncommerce/api-plugin-files.
Aside from the linker bash script this process also uses a tool called Yalc inside the container to separate modified packages from the rest of the codebase in the file system and symlink those packages to the application at runtime. Keep in mind we’re linking NPM packages running Node scripts so any packages linked will ultimately become synlinked from /usr/local/src/app/node_modules within the container’s file system (which remains different form the host).
Making it work. When I started working on API development I found two bugs in the package linking setup which made debugging not work properly. To view and apply the fixes please see the following pulls on GitHub: reaction/pull/6301 reaction/pull/6302.
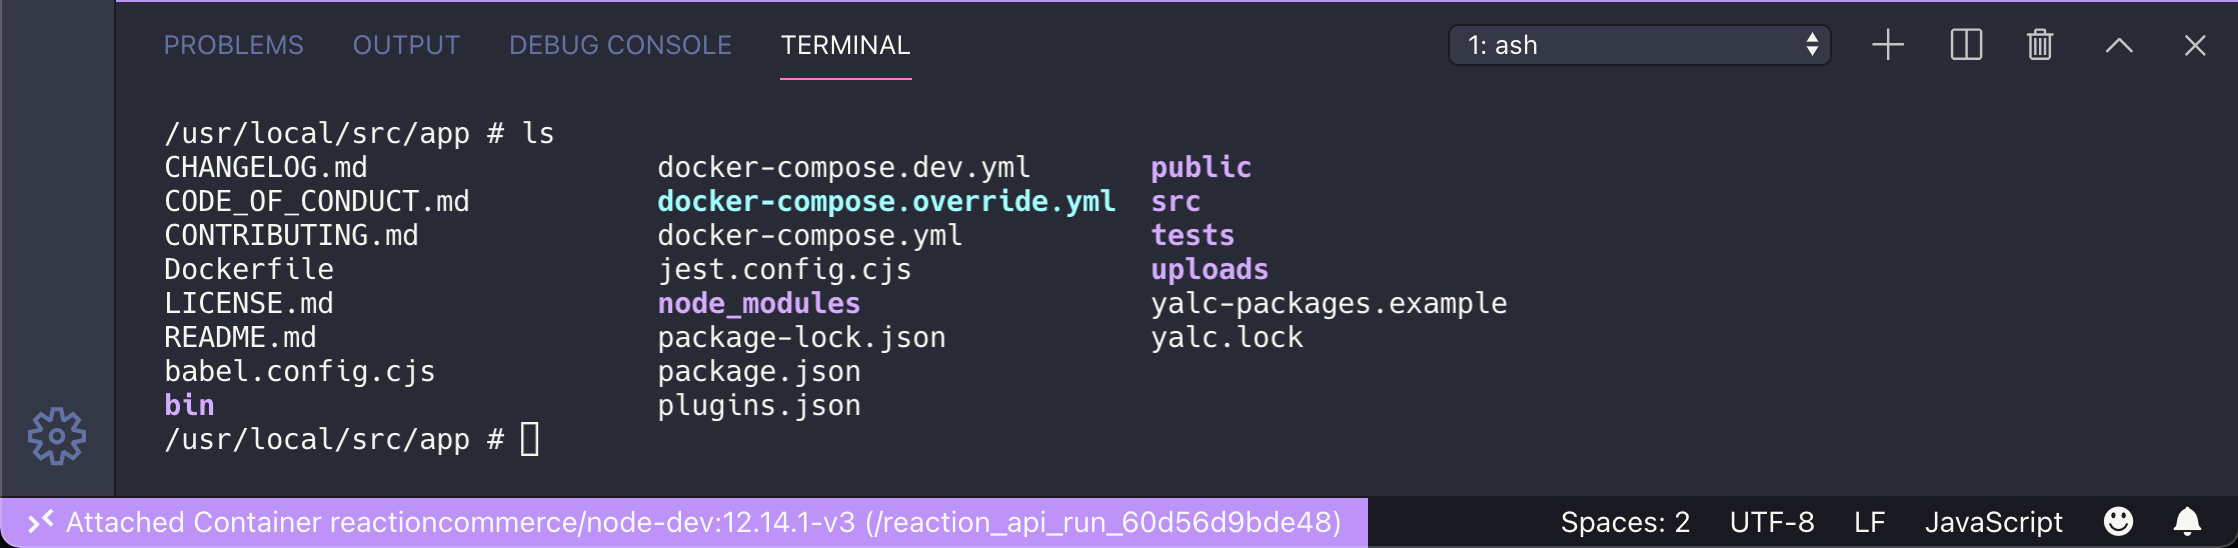
After that install the VSCode tool for Developing inside a Container and then use it to attach a VSCode editor the running API container. When VSCode attaches to the container you’ll be able to choose the workspace for the Explorer. Two potential options:
- /usr/local/src/app/ for the API source code
- /home/node/copied-packages/ for the Yalc copied packages
You want the first one for debugging purposes. Once specified, you can hit F5 to start debugging inside the container and set your breakpoints just like you would when working outside the VSCode-attached container.
bin/package-update whenever whatever package you’re debugging is changed the latest changes are available inside the Docker container.
Now you can develop and debug API plugins with step debugging inside Docker.
Summary
As you can see step debugging in Reaction Commerce isn’t much different than debugging any other Node.js project. Docker and the composition of the Reaction platform do add their unique challenges. But we have the tools we need today to do some incredible things with Node and Docker.
The difference from 10 years ago is that tooling has gotten a lot better thanks to more advanced IDEs like VSCode. Of course this is just one part of the API. Things get a little more complex when you start debugging the Job queue or Streams, both of which require slightly different debugging techniques.
Later I will update this post to include more types of debugging so don’t forget to check back soon!